I’ve been doing some Office 2013 training this month, so it seemed a good time to point out one of the clever features of Excel 2013.
Do you have sales data or other data listed by geographical area? You can now quickly display this data in map format with the click of a couple of buttons.
So what are the steps?
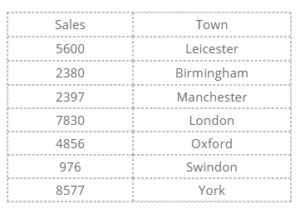
1. Enter the sales data and towns that you want to display into an Excel 2013 worksheet.
For example

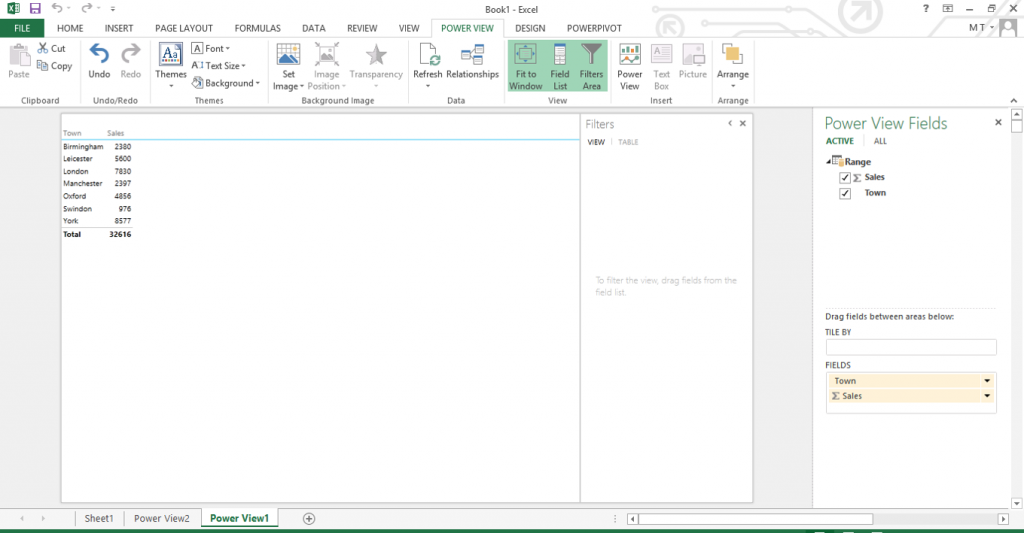
You may need to allow Excel to access Bing.2. Click Insert > PowerView
A new sheet will be displayed
3. Click on the Design ribbon.
4a. Choosing Table > Card creates a useful view
 4b. Choosing the Map option shows the following
How clever is that? To have all this functionality within a ‘standard’ package available to all, with the click of a few buttons gives us very powerful reporting and analysis tools.
What do you think? How would you make use of this tool? Is it worth the upgrade to Excel 2013? I would be really interested in your thoughts.


Hi Mary
If you’re in any sort of sales, marketing or business development role, this tool could be a real godsend. I can think of many uses to cover customers, competition, sales figures, market research etc. etc.
A really useful posting – thank you!
Regards
Julian